Urbanisation in Asansol Region during 1951-2001
4.1 Introduction
This chapter is a study of the urbanisation in Asansol region during the post independence period 1951-2001. We have discussed in chapter 2 that the formation and the course of evolution of a town depend on the spatio- economic characteristics of the region to which it belongs. We have studied the theory of urban hierarchy in this respect, while Chapter 3 narrated the historical perspective of Asansol and its surrounding mining region in the colonial period.
India gained independence on the 15th August, 1947. Thereafter, the economic policy of independent India was evolved accordingly to serve the interest of her people. As a consequence, the ownership of the collieries changed hands to indigenous entrepreneurs. The industries were as yet confined mainly in Asansol, Kulti, Burnpur and Raniganj. Asansol was the largest town of them. Further, after independence, the exigency of revamping the railways called for a locomotive works. The construction of a locomotive factory was started as early as in 1948 at Chittaranjan, 30 kms away from Asansol, since both steel and coal were available there in West Bengal.
India however spelled out its first resolution on the Industrial policy in the year 1948. Accordingly, the year 1951 saw the beginning of the First Five Year Plan. Thus 1951 became the point of initiation and hence we seek to trace the spatio- economic changes of Asansol region from 1951 till 2001.
Along this time scale the economic policy of our country has changed its course significantly at least twice in 1971 and 1991. We will study the urbanisation of Asansol region under three time periods-
- Pre nationalisation period-1951-1971
- Post nationalisation period -1971-1991
- First decade of the post Liberalisation period- 1991-2001.
Accordingly, the rest of the chapter has been organised as follows. The next three sections 4.2, 4.3 and 4.4 analyse spatio- economic changes here during the Pre- nationalisation period 1951-71, Post-nationalisation period 1971-1991 and the beginning of post-liberalised era 1991-2001. The section 4.5 presents the report of the primary survey in the three coal mines in this region in 2007 emphasizing the socio- economic conditions of the employees of Eastern Coalfield Limited at present. The section 4.6 enumerates the concluding remarks.
4.2 Spatio-Economic Changes in the Asansol Region During The Pre- Nationalisation period, 1951 -1971
The Industrial Policy Resolution of 1948 categorically divided the industries for the private and the public sector. Rail transport being of national importance was in the first group of exclusive state monopoly. The industries of basic and strategic importance like producing machine parts for telecommunications were the state controlled ones. The right to decision for new investment in these sectors belonged only to the government. The third group included different intermediate and capital goods industries and basic industries like cement. These industries were generally in the hands of private entrepreneurs but were subject to the state regulation and control. The fourth group were totally left to the investment decision of private sector thus making the Industrial Policy a basis for mixed economy. The First Five Year Plan of the Indian economy was initiated on 1951 which emphasised on agricultural development. The Indian economy was embedded to the Mahalanobis Planning strategy during the period from mid fifties to the mid sixties which stressed the long term benefit of investing in basic and capital goods industries. This emphasis was reiterated in the Industrial Policy Resolution of 1956. With a view to bringing about the socialistic pattern of society, it was decreed that the need for planned and rapid development require that all industries of basic and strategic importance be in the public sector.
The implementation of this policy required strategy of balanced industrial growth. If steel capacity was to be increased, there had to be a matching expansion in coal and iron ore, in the capacity of railway to and from the steel factories and the steel processing and consuming industries.
The industries of the Asansol-Raniganj region were mainly the basic and capital goods producing ones. Therefore, the aforesaid Industrial Policies played significant role in the industrial-urban growth in the region and there was thus inflow of industrial capital. It helped in the evolution of many new large and small towns in this region during 1951-1971. Some towns were the outcome of planned investment, some were spontaneous. Chittaranjan (1961), Durgapur (1961) and Hindusthan Cables Town (1971) were product of public investment whereas Sarakdi-Nadiha (Sen Raleigh Township, 1971) and Jemari (J.K.Nagar Township, 1971) were the outcome of private investment. Niamatpur (1961), Ukhra (1961), Jamuria (1961) and Dishergarh (1971) got the status of town due to increase in population and expansion of mining activities.
4.2.1 The Study of the Urban Hierarchical Structure in the Asansol Region
The urban growth of this region is a combined impact of emergence and growth of some new towns as well as the increase in population of the existing towns. The following table 4.1 reveals the nature of urban hierarchy during our study period.
Table 4.1
Urban Hierarchy - Asansol Region, 1961-1971
Rank
|
1961
|
1971
|
1
2
3
4
5
6
7
8
|
Asansol
Burnpur
Durgapur
Kulti
Raniganj
Chittaranjan
Ondal
Barakar
|
Durgapur
Asansol
Burnpur
Chittaranjan
Raniganj
Kulti
Ondal
Barakar
|
Rank
|
1961
|
1971
|
9
10
11
12
13
14
15
|
Niamatpur
Ukhra
|
Niamatpur
Dishergarh
Ukhra
Jemari
H.C.Town
J.K. Nagar
Sarakdi- Nadiha
|
Source: Computed from the data provided in Lahiri-Dutt, Kuntala (2001). Mining and Urbanization in the Raniganj Coalbelt, Calcutta, The World Press Private Limited.
The position of Asansol and Burnpur changed after the formation of Durgapur. Durgapur emerged as the largest city in 1971. Moreover the new town Chittaranjan came ahead of Kulti, an old town.
Historically, urban development in this area was based on mining and manufacturing based industries (Giri, Pabitra.1998, p.100). So we have selected the following seven industrial- urban spaces to study the urbanisation pattern in the region.
- Asansol
- Raniganj
- Durgapur
- Kulti
- Chittaranjan
- Hindusthan Cable Town (Rupnarayanpur)
- Jamuria
The Map 4.1 - the Asansol Durgapur Planning Area shows the location of these urban centres in this region .
Map 4.1
 The table 4.2 gives the status & spatial areas of these urban centres in the study period.
Table 4.2
Area (in Sq Km) of Selected Towns in the Asansol Region from 1951 – 1971
Urban area/Town
|
Size Class/Status in 1971
|
1951
|
1961
|
1971
|
Asansol
|
1/M
|
10.41
|
10.44
|
10.44
|
Raniganj
|
111/M
|
4.79
|
4.79
|
4.79
|
Kulti
|
111/N.M
|
3.11
|
7.90
|
7.90
|
Jamuria
|
V/N.M
|
-
|
6.22
|
6.22
|
Durgapur
|
1/N.A.
|
-
|
73.69
|
154.20
|
Chittaranjan
|
111/N.M
|
16.91
|
16.91
|
16.91
|
H. C. Town
|
V/N.M
|
-
|
-
|
3.90
|
Source: Mitra, A. and Prakash, Sachdev Ram (1980), Population and Area of Cities, Towns and Urban Agglomerations, 1872-1971, New Delhi, Allied Publishers Pvt Ltd.
The table 4.2 shows that there have been spatial expansions of towns like Asansol and Kulti due to administrative exigency during the time period 1951- 1971. Durgapur, a planned township experienced rapid spatial expansion. Though it emerged as steel town, over the decade it accommodated other industries with forward and backward linkages resulting in the expansion of the area. However, the spatial area of the planned single industry township Chittaranjan remains unchanged over the decades.
We are studying some basic demographic and socio- economic indicators like population growth, density, gender ratio, literacy rate, work participation ratio, the pattern of trade, commerce and banking of these selected urban centres here to observe the nature of urbanisation and the settlement pattern in this region.
The following two tables give an idea about the population growth during this time period. In Table 4.3 the towns created in the colonial period are included. It displays their pattern of growth in the era of public sector industrialisation during the first two and half decades after Independence.
Table 4.3
Decadal Growth Rates (% of Urban Population) 1951-1971
Urban area/Town
|
Years & % Decade Variations
| |
1951-1961
|
1961-1971
| |
Asansol
|
+35.57
|
+50.83
|
Raniganj
|
+16.09
|
+33.18
|
Kulti
|
+9.30
|
-13.46
|
Source: Mitra, A. and Prakash, Sachdev Ram (1980), Population and Area of Cities, Towns and Urban Agglomerations, 1872-1971, New Delhi, Allied Publishers Pvt Ltd.
The towns mentioned in the following table 4.4 are those which were formed during the post independence period.
Table 4.4
Decadal Growth Rate (% of Urban Population) 1951-1971 in New Towns
Urban area/Town
|
1951-1961
|
1961-1971
|
Chittaranjan
|
+79.17
|
+40.68
|
Durgapur
|
-
|
+395.58
|
Jamuria
|
-
|
-44.05
|
Source: Mitra, A. and Prakash, Sachdev Ram (1980), Population and Area of Cities, Towns and Urban Agglomerations, 1872-1971, New Delhi, Allied Publishers Pvt Ltd.
Durgapur experienced the maximum rate of urbanisation among the urban centres created in the post independence period. The negative growth rate of the old town Kulti suggests that this single industry town has attained its saturation stage. Jamuria, the new town, also experienced negative rate of growth. This might be an instance of Backwash Effect as the neighbouring town Durgapur, grew enormously due to the impact of the public sector industrialisation policy.
Apart from the variation of population growth, there were economic changes associated with these urban areas. Functional characteristic of a town shows the nature of economic expansion. The main functional characteristic of the selected urban spaces in 1961 and 1971 is given below in the table 4.5.
Table 4.5
Main Functional Category, Selected Towns-Asansol Region 1961 & 1971
Urban area/Town
|
Functional Category
| |
1961
|
1971
| |
Asansol
|
Trade and Transport
|
Trade and Transport
|
Kulti
|
Manufacturing
|
Trade and Transport
|
Raniganj
|
Manufacturing
|
Trade and Transport
|
Chittaranjan
|
Manufacturing
|
Manufacturing
|
Durgapur
|
Manufacturing
|
Manufacturing
|
Hindusthan Cables town
|
-
|
Manufacturing
|
Jamuria
|
Manufacturing
|
Manufacturing
|
Source: Chatterjee, Mahalaya and Giri, Pabitra. (Aug 2001) Functional Classification of Urban Areas in India, Urban Database Series No.1, Kolkata, Centre for Urban Economic Studies, University of Calcutta.
The regional economy was thus mainly manufacturing and trade based one. Asansol, due to its excellent intra and inter regional transport network and built infrastructural facilities for trade was known as the trading city. The significant growth of Burnpur, the steel town resulted in the enlargement of Asansol Urban agglomeration consisting of Asansol, Burnpur and Outer Burnpur. The economy of Kulti and Raniganj, the old towns started to diversify from manufacturing to trading activities during our study period. The economic activities of the different towns in this region also complemented the needs of one another and enriched the industrial growth. For instance, the rolling mills and steel casting facilities in Raniganj supported the intra regional growth of metal fabrication sectors. Raniganj town recorded a considerable rate of urban population growth in the first three decades especially in the 1960’s. Bengal Paper Mill was established at Ballabhpur, Raniganj due to presence of raw material like forest resource Asan trees, transport facilities for inter regional and inter state export and most importantly the use of the local coal as fuel.
While Asansol, Burnpur, Kulti, Raniganj towns as we have already seen had their beginnings in the colonial period, Chittaranjan, Durgapur, H.C Town and Jamuria came up during the post colonial period. Towns like Chittaranjan and later Rupnarayanpur were constructed for reaping the benefits of external economies of agglomeration. Chittaranjan is a single industry habitation renowned for its Chittaranjan Locomotive Works. It was treated as a town for the first time in 1951. It rapidly occupied an important position in the urban hierarchical structure in two decades. The industry producing steam loco and electric locomotives acted as forward linkage for the utilization of steel produced in this industrial sub division. Chittaranjan is a planned township, the settlement pattern and land use is fully controlled by railway authority without any provision of private land ownership.
Jamuria was treated as a non municipal town for the first time in 1961. It was a manufacturing town with collieries and some rolling mills.
Hindusthan Cables Town in Rupnarayanpur, as the name itself suggests busied itself in cable production. Hindusthan Cables Ltd is a Government of India undertaking and the only manufacturer of underground dry core telephone cables and coaxial cables in India which was set up at Rupnarayanpur, near Chittaranjan. Cable industry has forward linkage with both railways and mining industries. The regular production started in 1954. In the 60’s and early 70’s the production increased steadily every year and the products have been commended as the best in the country. Hindusthan Cables Town got the status of town in 1971 though it had well developed built space since the sixties.
Among the small manufacturing towns, Sarakdi Nadiha or Sen Raleigh Township needs mention. Sarakdi Nadiha got the status of a town in 1971 but a de facto urban area even in the sixties. Sarakdi -Nadiha or Sen Raleigh Township is in the Kanyapur locality in the neighbourhood of Asansol Municipality. The Sen- Raleigh Cycle factory, a collaboration of the Raleigh Cycle of USA and Abhijit Sen was established in 1951.Thus it was an example of private entrepreneurial initiative. More than 60% of the workers were housed in the well planned township which covered about 600 acres of land.
Durgapur needs our special attention in this context since it was Durgapur that effected an overall change in this region during the post independence period. Durgapur, the most important urban centre as the urban hierarchical structure informs emerged as the product of public sector industrialisation drive. In 1961, Durgapur Town Group was recorded for the first time in Census Record. The constituents were Durgapur Steel Project Area and Durgapur Coke Oven Plant Area. Durgapur was recognised as a Notified Area in 1971. The construction work for the Durgapur Steel Plant started during the Second Five Year Plan but the nuclei of the town is created earlier during the constructions of the Durgapur Barrage by the Damodar Valley Corporation and the Durgapur Projects Ltd., by the West Bengal Government in the early 1950’s (Basak, 2000). The spatial advantages which made Durgapur a steel city were:
- The advantage of built space of power, water supply, rail and road communication, easy access of industrial land
- The linkage effect - the industries of this town were mainly basic metal, non-metal and chemical based ones. They are weight losing in nature and are high fuels consuming ones due to nearness to the coal mines, not very far from the iron deposit in the Gua region of Orissa and other raw material base (Basak, 2000).
- The internal economies of scale and the external economies of agglomeration among the users of jointly supplied products.
Between 1955 and 1970, a series of large and medium industries and to cater them, a number of small industries grew up in Durgapur due to linkage effect. Notable among them were Durgapur steel Plant, Durgapur Projects Limited, ACC-Vickers-Babcock producing cement making machinery & boilers, Alloy Steel Plant, Fertilizer Corporation of India, Durgapur Thermal Power Station (unit of DVC), Mining and Allied Machinery Corporation (a Central Government undertaking) producing coal mining, bulk handling equipments and other heavy machinery.
Thus there was a stunning growth of manufacturing industries both large scale and small scale in the Asansol–Durgapur belt in the first two decades after independence. They include iron- steel metal, metal product, industrial machinery, non- metallic mineral product, industrial chemical, chemical product, coal product, and repair and servicing, others like wood product, readymade garments and food product. The table- 4.6 below shows the locational distribution of the significant small scale manufacturing units in this region during our study period.
Table 4.6
Locational Distribution of Small Scale Industrial Units, Asansol Region
Location
|
Product
|
Asansol
|
Automobile Workshop
Fabrication and machining
Mining Equipment
Ferro alloy
Light Engineering Works
Electrical Equipment
Refractory items
Lancing tubes
Colour Laboratory
Leather based products
Paints and Varnish
Printing Press
PVC products
Rubber based products
Readymade & Woollen garments
|
Location
|
Product
|
Durgapur
|
Automobile Workshop
Fabrication and machining
Ferro alloy
Light Engineering Works
Pharmaceuticals
Refractory items
Steel casting
Lancing tubes
Colour Laboratory
Leather based products
Packaging industry
Paints and Varnish
Printing Press
PVC products
Readymade garments
Woollen garments
|
Raniganj
|
Mining Equipment
Electrical Equipment
Rolling mills
Steel casting
Readymade garments
|
Kulti
|
Refractory items
Colour Laboratory
|
Jamuria
|
Rolling mills
|
Barakar
|
Refractory items
|
Salanpur
|
Ferro alloy
|
Source: Basak Nandita (2000), Dynamics Of Growth Regional Perspective, Calcutta, Firma KLM Private Limited, p123
The above table shows that the small scale industrial units were concentrated in Asansol, Durgapur and Raniganj during our study period. As there had been major public sector multi industrial investment in Durgapur, private investments in small and medium industries flowed here. Asansol and Raniganj being reputed trade- transport and manufacturing hub also pulled spontaneous industrial investment .The industrial structure of these towns got diversified with a series of linked industries having either forward or backward type of linkages with the core sectors. Steel casting and forging, chemical and coal products, non metallic mineral products were the most important of them. For example, heavy metal fabricating industries acted as forward linkage for steel rolling and casting facilities whereas availability of by–products from coke ovens is an inducement to establish a considerable range of chemical processes in steel making centres. Thus they were located in Asansol and its neighbourhood Jamuria, Raniganj and Durgapur. Similarly, producers of coke for blast furnaces turn out gas and a variety of hydrocarbon chemicals. They serve as building blocks for products like synthetic gasoline, dyestuffs and pharmaceuticals. The high rate of urbanisation induced flourishing of manufacturing units in the small scale sector like ready made garments, leather based products in these towns in this region. The industrial structure of the towns like Kulti, Barakar and Salanpur shows that production was related either directly or indirectly to the core sector viz. coal and coke-products and basic metal.
Kulti, Chittaranjan, Burnpur, Asansol, Jamuria, Raniganj and Durgapur are very near to one another and doubtless the G.T Road that goes through them became one of the busiest industrial- urban corridors where there is ceaseless flow of transport. Hence automobile workshops mushroomed on either side of the G.T Road. Other ancillary industries were also established consequently. They included light engineering industries producing automobile parts, cycle parts, electric motor and other electric gadgets. There were other small engineering ancillaries like nuts, bolts, buttons, springs, pipes and pipe fittings, sanitary fittings, building hardware, wire and wire net etc.
The Map 4.2 depicts the concentration of industries in the Asansol- Durgapur region during this time period.
Map 4.2

4.2.2 The State of the Economy 1951-1971
During 1951-1971, production of coal increased due to the escalating exigency of energy. The number of collieries functioning in the Asansol Sub-division was 205 during 1970-71, employing about 1.4 lakh workers. (West Bengal District Gazetteers Burdwan, 1994. p.215). Most of the collieries were then under private ownership.
According to APO (1977), the registered factories in this region which starts from Durgapur in the east and stretches westward to Raniganj, Asansol, Burnpur, Kulti, Neamatpur, Rupnarayanpur and Chittaranjan employed 40,000 workers in ’51 and 96,000 workers in the middle of the seventies denoting a compound rate of increase of 3.52 per year (Asansol Planning Organisation, 1977). The basic metal and engineering industry groups together constituted about 82.19% of the total employment increase during ’57-’70. The following table 4.7 depicts the absolute increase in manufacturing employment and the annual compound rate of growth of manufacturing employment in the Asansol Region.
Table 4.7
Absolute Increases in the Manufacturing Employment and the Annual Compound Rate of Growth of Employment, 1951-1971
Sector
|
Absolute Increase In Manufacturing Employment
|
Annual Compound Rate of Growth of Employment
| |
1951-61
|
1961-71
| ||
Registered Sector
|
15860
|
26013
|
3.51%
|
Source: Asansol Planning Organisation (1977). Report on Industrial Situations in Asansol Planning Region, 1951-1975, Asansol.
The above table indicates a positive employment scenario in the registered sectors here.
The structure and functions of the regional economy could be studied from the occupational distribution of the people there. The figure 4.1 below shows the occupational distribution of the workers in this sub division in 1961.

Fig 4.1
Source: Biswas, K.R. [State Editor]( 1994). West Bengal District Gazetteer: Barddhaman, Kolkata, Education Department, Government of West Bengal
It reveals that manufacturing and mining provided jobs to more than half of the population here in the fifties.
To serve the collieries and the other manufacturing and trade sectors, in-migration to Asansol region from different parts of the country took place. The next sub section seeks to analyse of the nature of migration in particular and the pattern of settlement.
4.2.3 In-Migration in the Region
Migratory flow to a particular destination changes over time. So it is necessary to specify the interval of time over which migration is to be observed.
The following figure 4.2 shows the distribution of migrants in four time periods for five main urban centres of this region.
Percentage Distribution of In-Migrant Population in Five Urban Centres of Asansol Region during 1947-1972
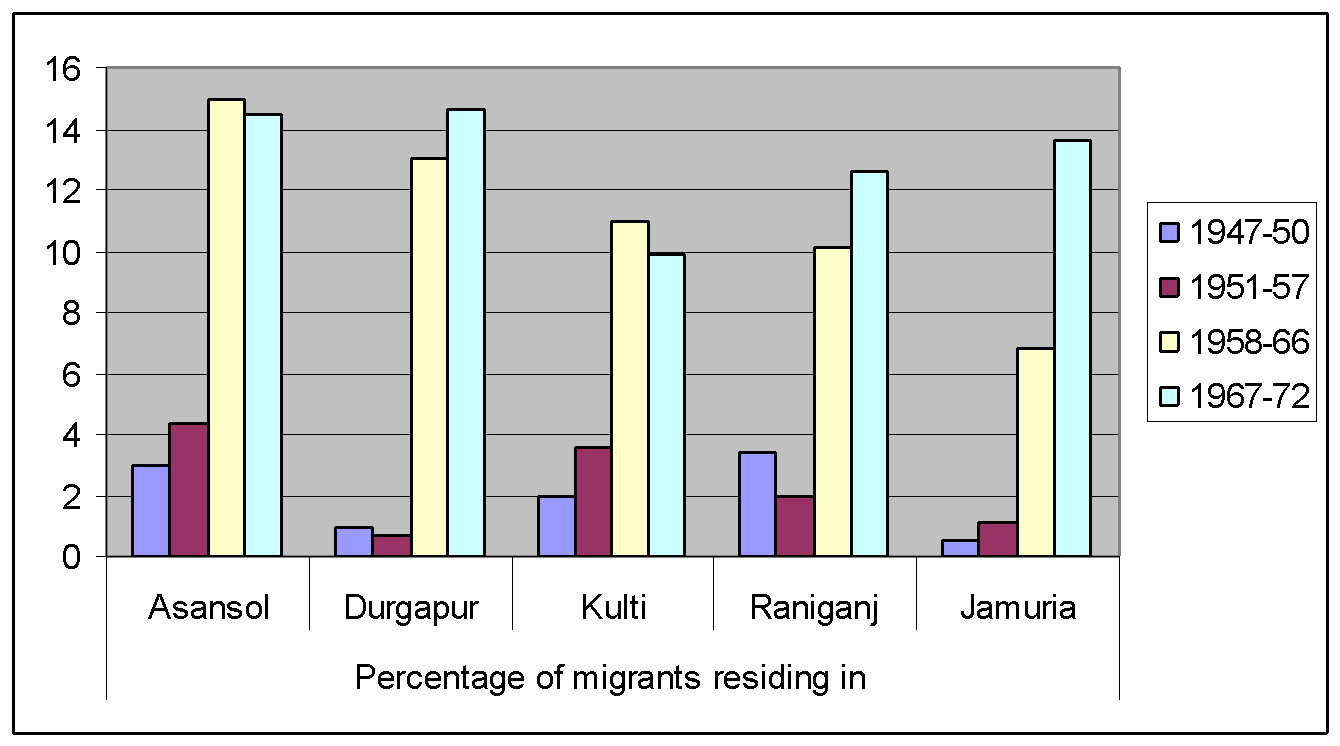
Fig 4.2
Source: Asansol Durgapur Development Authority (2001). Socio-Economic and Demographic Profile of People in the Asansol-Durgapur Planning Area 2000-01, Asansol.
Asansol, Kulti and Raniganj were main destination for the in-migrants from the beginning. However, Asansol attracted more people in the region especially up to mid sixties due to its good transport linkage and due to its comparatively diversified industrial and trade base. Durgapur however attracted the in migrants most in the late 60’s with its planned industrialisation and it also helped to transform Jamuria into a town with ancillary sectors and new job scope.
In this highly industrialised mining region, in migrant from outside the state was living in large numbers. For example, in the Asansol sub division, 20.56% of the total population in 1961 reported their mother tongue as Hindi (West Bengal District Gazetteers, Barddhaman, 1994). Moreover, after independence there was in-migration to Asansol for another reason. The Partition of India impelled homeless refugees from East Pakistan now Bangladesh to come to Asansol.
They settled in the locations having comparatively better built space like Kulti, Raniganj and Asansol. Jamuria was also a centre for residential location for the new entrants, being in the neighbourhood of the well-known towns Asansol and Raniganj. Durgapur with its huge inflow of industrial capital also needed different skills and thus attracted people here in the late sixties and early seventies.
A decision to settle in a new space can be influenced by many factors. The following figure 4.3 shows some reasons applicable for Asansol region.
Percentage Distribution of Migrant Persons by Reasons for In-Migration in Different Urban Areas of Asansol Region

Fig 4.3
Source: Asansol Durgapur Development Authority (2001). Socio-Economic and Demographic Profile of People in the Asansol-Durgapur Planning Area 2000-01, Asansol.
Chart 4(iii) displays clearly that the in-migration patterns in the urban centres was influenced by different forces. We are analysing them below:
- In search of employment - People moved into this region in response to perceived difference in prospective real income as well as other factors. There is no doubt, that the myth of this zone being a booming centre of industrial and mining activities drew people. The migration theories presume that migration is easier along paths used by many previous migrants from the same area and to a particular destination. This was applicable in case of this region then, a known place for immigrants of neighbour states and districts since the late nineteenth century.
- Take-up gainful employment - The characteristic of both the origin and the destination space is an important reason for in-migration. The explicit reasons for migration were the pull factors like the search of employment and to some extent getting employed in this industrial region in the era of heavy industrialisation.
Again, the distribution of migrant population in different urban centres in this region shows some divergence. For instance, the percentage of persons taking up gainful occupation was quite high for Asansol and Kulti. The well known old towns attracted more in migrants.
- Education- Only about 2% in- migrant had come in this region in pursuit of education.
- Stay with spouse – ‘Staying with spouse’ was the main reason for in-migration in these towns during our study period. In fact, employment was the pull factor for in migration here. There were service quarters for employees connected with mining, large industries and rail. Many of the in-migrants counted in ‘stay with spouse/guardian’ in the chart accompanied those migrants who came to these towns for employment.
- Others – A small percentage of in- migration was due to reasons other than those mentioned above.
The Chart 4(iii) shows that the ‘staying with spouse’ and the ‘search for employment’ were the two major factors of in -migration here. As these two factors were the major reason for urbanisation, let us have a look into their figures in the next sub section.
4.2.4 Gender Ratio and Work Participation Ratio in Asansol Region
Gender ratio is an indicator of the settlement pattern. The table 4.8 shows the changes in the gender ratio in our study period.
Table 4.8
Changes in the Gender Ratio, 1951-1971
Urban area/Town
|
Gender ratio
| ||
1951
|
1961
|
1971
| |
Asansol
|
936
|
664
|
751
|
Kulti
|
687
|
733
|
784
|
Raniganj
|
885
|
773
|
780
|
Chittaranjan
|
425
|
753
|
774
|
Jamuria
|
-
|
651
|
792
|
Durgapur
|
-
|
338
|
764
|
Hindusthan Cables Town
|
-
|
-
|
772
|
Source: Computed from the data of Census of India, District Census Handbook for Barddhaman 1951, 1961 and 1971.
The above table shows that in 1951 in Asansol there were 936 women per 1000 men. In 1961 gender ratio was 664 and it was 750 in 1971. Thus there has been a fall in the gender ratio in the two decades. This is perhaps due to the fact that since the fifties, a rapid growth of manufacturing including mining activities occurred where male work force from outside the region participated. The gender ratio in Kulti and Chittaranjan was steeply skewed in 1951 and in Durgapur in 1961. The ratio became less skewed in 1971. In 1971 the same gender ratio prevailed in every aforesaid urban area.
The work participation ratio is also an indicator of the spatio- economic interactions. The Table 4.9 shows that female work participation rate was rather negligible during 1961-1971.
Table 4.9
Percentage of Total Workers to Total Population, Asansol region, 1961-1971
Urban area / Town
|
Work Participation Rate
| |||||
1961
|
1971
| |||||
Person
|
Male
|
Female
|
Person
|
Male
|
Female
| |
Asansol
|
33.94
|
54.82
|
2.48
|
26.56
|
45.25
|
1.66
|
Raniganj
|
32.85
|
53.41
|
6.24
|
28.00
|
47.23
|
3.35
|
Kulti
|
74.60
|
56.25
|
3.43
|
26.73
|
45.92
|
2.27
|
Jamuria
|
40.33
|
60.32
|
9.62
|
24.80
|
42.50
|
2.46
|
Durgapur
|
62.47
|
80.30
|
9.67
|
30.90
|
51.77
|
3.60
|
Chittaranjan
|
30.38
|
52.19
|
1.43
|
27.14
|
43.63
|
2.31
|
H. C.Town
|
-
|
-
|
-
|
27.53
|
46.39
|
3.12
|
Source: Computed from the data of Census of India, District Census Handbook for Barddhaman 1961 and 1971.
Work participation ratio depends on the composition of family structure. Within a family, there can be children and old persons who cannot work. As a result, work participation ratio can reflect a downward trend when an area becomes a favourable place to live with the whole family. Table 4.9 reflected this trend. Urban infrastructure development brings a rise in family units. It seems that public sector industrialisation helped on this count.
The seventies saw a radical change in the economic policy of India. Our next section analyses its impact on the spatio- economic structure of this region.
4.3 The Economy of Asansol Region during the Post-Nationalisation Period, 1971- 1991
This period was the era of nationalisation of different industries and the banking sectors. It was marked by enormous government involvement in the industrial scenario of the country. Consequently the coking coal industry was taken over in October 1971, followed by the takeover of the non coking coal industry in the beginning of 1973, leading to the nationalisation of the entire coal industry in May 1973. The MRTP Act of 1969 checked the expansion of large private industrial houses.
Prime reasons for nationalisation were:
- Contemporary mining methods were leading to great wastage.
- Government predicted that the future demand for coal would be particularly heavy in view of its industrial development priorities.
- During the sixties despite increase in production, there was a shortfall in private capital investment in this industry.
The Eastern Coal fields Limited (ECL hereafter) was created for the development of mining sector in this region. This brought about a big change in the Asansol region. The positive employment policy of the ECL expanded the service sector. There were 1.8 lakhs workers at ECL in 1973-74 which increased to 1.92 lakhs in 1983-84. There had been a notable rise in wage structure just after nationalisation.
ECL expanded the mining area. Earlier in 1971 there were only three such towns. They were Dishergarh, Jamuria and Ukhra. New townships in the decade between 1981- 1991 shot up where mining was the dominant activity (Paul, Sudipta. 2003). Even some pre dominantly agricultural space like Sripur in this region turned gradually into mining areas adopting many mining based urban features (Nayak D, 2006). The following table 4.10 depicts the list of these towns, their population and their decadal growth rate.
Table 4.10
Name, Population and Decadal Growth Rate of New Towns in the Asansol Region, 1981-1991
Name of New Towns
In 1981
|
Population
|
Growth Rate
1981-1991
|
Name of New Towns In 1991
|
Population
1991
| |
1981
|
1991
| ||||
Kajora
Sripur
Kenda
Ninga
Bagra
Bhanwara
Chora
Bahula
Murgathaul
Dignala
Sukdal
Chak Bankola
Ballavpur
Amkula
Parashkol
Satgram
Raghunathchak
Parasia
Khandra
Charanpur
Damodarpur
Kaithi
Shankarpur
Mukundapur
Madhusudanpur
Siduli
Gaidhoba
Bengarya
|
12969
12372
11671
9635
8333
8258
8193
8007
7158
6976
6903
6726
6606
6423
6108
5629
5062
4823
4649
3314
3210
3131
3129
2650
2411
1811
1505
1025
|
18832
17567
12872
12569
9145
7168
8193
14491
8314
8742
9577
11516
5576
7657
8437
7129
4776
8260
15939
3410
4458
3867
4746
2705
2865
8977
566
2767
|
45.21
41.91
10.29
30.45
9.74
13.20
46.80
80.98
16.15
25.32
38.74
71.22
-15.50
19.21
38.13
26.65
-5.65
71.26
242.84
2.89
38.87
23.50
51.68
2.07
18.83
395.69
-62.39
169.65
|
Siarsol
Konardihi
Dalurbad
Dakshinkhanda
Baidyanathpur
Baska
Kankhaya
Chelad
Pariharpur
Banali
Nandi
Egara
Sarpi
Haripur
Mandarbani
Chapui
Banagram
Palash Ban
Ratibati
Nimcha
|
20355
11543
10372
9194
8957
8711
7880
7646
7100
7086
7022
6206
5849
5782
5771
5029
5016
4925
4553
1453
|
Source: Computed from the data provided in Lahiri-Dutt, Kuntala (2001). Mining and Urbanization in the Raniganj Coalbelt, Calcutta, The World Press Private Limited.
The above table shows that twenty eight new towns emerged in 1981 and further twenty towns showed up in 1991 in this region. Some of these new towns evolved as a result of the availability of the urban amenities in them thanks to ECL.
In 1981, there were three new towns Kajora, Sripur and Kenda in Class IV size-category. Fourteen towns were in Class V category and the remaining eleven were in Class VI category. In 1991, among these towns, seven were in the Class IV category; twelve came in Class V and nine in the Class VI size category. However, the growth of these towns was uneven. Some of them experienced a very high growth rate whereas a majority enjoyed moderate rate of growth of population. Three towns recorded negative rate of growth of population. Among the towns which emerged in 1991, only Siarsol was in Class III category. Two towns were in Class IV size category, fourteen towns were in Class V category and the remaining three were in the Class VI category. This uneven growth pattern also changed the urban hierarchical structure as we will see afterwards.
Compared to these new towns, the reputed urban centres like Asansol, Raniganj, Chittaranjan and Durgapur experienced a slow rate of growth in the seventies as compared to the 60’s. However the rate of urbanisation in Asansol and Hindusthan Cables Town (H.C. town) increased during the 80’s. But it was negative in Chittaranjan. The following table 4.11 shows the rate of urbanisation in the selected towns here during this period.
Table 4.11
Growth Rates of Urban Population (% Decade Variations), 1971-1991
Urban area/Town
|
Years & % Decade Variations
| |
1971-1981
|
1981-1991
| |
Asansol
|
17.57
|
42.98
|
Raniganj
|
28.74
|
26.90
|
Kulti
|
69.41
|
44.63
|
Jamuria
|
28.22
|
21.80
|
Durgapur
|
50.89
|
36.57
|
Hindusthan Cables Town
|
55.90
|
79.69
|
Chittaranjan
|
24.58
|
-7.02
|
Source: Compiled from the Census of India, District Census Handbook, Barddhaman 1971, 1981 and 1991
The spatial area of Asansol and Chittaranjan expanded during this time period. The following table 4.12 demonstrates that.
Table 4.12
Area (in Sq Km) -Asansol & Chittaranjan, 1971-1991
Urban area / Town
|
Size Class/Status
|
1971
|
1981
|
1991
|
Asansol
|
1/M
|
10.44
|
20.92
|
25.02
|
Chittaranjan
|
111/N.M
|
16.91
|
19.65
|
19.65
|
Source: Census of India, District Census Handbook, Barddhaman 1971, 1981 and 1991
However the overall level of urbanisation was very high in this region due to the emergence of this large number of urban centres in 1981 and 1991 though the growth of the existing towns decelerated. For instance from nine urban centres in the Asansol Durgapur area in 1951, the number rose to fifty in 1991 (Guha, 1996). The following table 4.13 shows the nature of urban hierarchy in this region in 1981 and 1991.
Table 4.13
Urban Hierarchy - Asansol Region, 1981-1991
Rank
|
1981
|
1991
|
1
2
3
4
5
6
7
8
9
10
11
12
13
|
Durgapur
Asansol
Burnpur
Chittaranjan
Raniganj
Kulti
Barakar
Ondal
Dishergarh
Kajora
Ukhra
Sripur
Jamuria
|
Durgapur
Asansol
Burnpur
Kulti
Dishergarh
Raniganj
Niamatpur
Chittaranjan
Siarsol
Kajora
Ukhra
Sripur
Ondal
|
Rank
|
1981
|
1991
|
14
15
16
17
18
19
20
|
Kenda
Chora
Jemari
Ninga
H.C.Town
Raghunathchak
Bagra
|
H.C.Town
Jamuria
Bahula
Kenda
Jemari
Ninga
Chora
|
Source: Computed from the data provided in Lahiri-Dutt, Kuntala (2001). Mining and Urbanization in the Raniganj Coalbelt, Calcutta, The World Press Private Limited.
The above table informs us about the growth of new towns in the region as well as shows the changes in the rank of the selected towns we are studying here. The position of Asansol remains unchanged but Burnpur, Kulti, Chittaranjan Raniganj and Hindusthan Cables Town experienced changes in the urban status. Some of the new towns which emerged in 1981 also experienced changes as to their rank in this urban hierarchical structure due to uneven population growth.
Manufacturing and trade- transport were the dominant economic activities in this region (Chatterjee and Giri, 2001). The basic metal and engineering industry groups together constituted 97.36% of employment here during ’70-75 (APO, 1977). Another study mentioned that basic metal industry, the largest employer here from 1951- 1991 employed 40% of work force in 1991 (Guha, 1996).
The following tables 4.14 and 4.15 give some records regarding the number of mines under ECL and the volume of production after nationalization.
Table 4.14
Number of Coal Mines in West Bengal
No of collieries
| |||
Open Cast (OC)
|
Under Ground (UG)
|
Mixed
|
Total
|
14
|
84
|
2
|
100
|
Table 4.15
The Production of Coal (in MT) of ECL during Mid 70’s and Mid 80’s
ECL
|
74-75
|
84-85
|
Under Ground (UG)
|
20.50
|
16.67
|
Open Cast (OC)
|
2.66
|
6.44
|
Total
|
23.16
|
23.11
|
Tables 4.14 and 4.15 show the number of underground and open cast mines and the production (in MT) of ECL in the 70’s and 80’s. The table 4.14 shows that most of the mines of West Bengal were underground mines during that period and table 4.15 informs that production reduced from mid 70’s to mid 80’s. ECL made cumulative losses over the period 1981-86 (Coal India Ltd. 2002).
Production of steel, the other source of affluence of this region saw a steep fall. In the early 70’s, IISCO faced a near collapse. It was declared under BIFR as a sick enterprise. The policy of barrier to exit acted as a constraint to close the industry. The management of IISCO was taken over by the government in 1972. The table 4.16 shows that the production scenario was not an encouraging one during 1971-1991.
Table 4.16
Production of Steel in IISCO, Asansol (in .000 tonnes), 1971-1991
Year
|
Production
|
1972
|
347
|
1976
|
542
|
1981
|
488
|
1986
|
526
|
1991
|
287
|
Chakraborty, Jharna (1998). Evolution of Asansol- Durgapur Industrial Complex and Its Impact On Regional Economy, Unpublished Ph.D Thesis, Calcutta, Department of Geography, University of Calcutta.
In the days of private management IISCO, Burnpur had manpower of 18,000 for a production of 1 million tonnes of steel. Similar to the coal sector, here also with government takeover, the manpower increased to 28,000. Thus the welfare maximising attitude of the government led to the rise in employment in both steel and coal here even when these industries were not in a prosperous state.
So we can say that even though nationalisation gave a fillip to the overall development in the employment and urbanisation of the Asansol region, curiously enough the national economic policy had adversely affected the manufacturing sectors especially coal and steel . It shows that the correlation between production and urbanisation is not always positive. The report of a primary survey is summarised in Sec 4.5 where this issue has been discussed in details.
Major reasons of the deceleration which adversely affected the industries in this region can be summarised as follows:
- Freight Equalisation Policy (1956-1992)
- Substitution of coal based chemical industry by petro based chemical industry
- Barriers to exit
- Lack of technological up gradation
- Administrative and management problem
- The scarcity of high quality metallurgical coal
As we have mentioned earlier, the Freight Equalisation Policy (FEP) was a major factor to blame for the deceleration of steel and coal sector here. For reducing regional disparities of industrial growth, the government had followed FEP for many years. It was something like a postage stamp rate for important raw materials like coal, steel, cement for the whole of India. This in a sense deprived the locational advantage of this region which was close to the mineral extraction point.
Secondly, there had been a gradual shift of the mode of production from coal based to petro based chemical industries. The inability to introduce this latest technology affected the entrepreneurs of this coal based mining region.
The scarcity of high quality metallurgical coal was also a major problem for these heat intensive industries here in this period.
The decelerations in the coal and steel generated a phase of agglomeration diseconomies here. For instance, Indian Oxygen suffered due to lack of order from IISCO. The deceleration of IISCO, the backbone of this region also adversely affected the small and ancillary industries here. The internal administrative problem between management and labour union also adversely affected some industries here.
On the other hand, since there were barriers to exit, many sick private sectors were nationalised by the government in the seventies. IISCO Burnpur, J.K Nagar Aluminium (BALCO) and Sen Raleigh Cycle factory (Cycle Corporation of India) were some notable examples.
Despite the adverse production scenario in the manufacturing sector, in-migration continued here. The Fig 4.4 displays the information regarding in migration here in this time period.
Percentage Distribution of In-Migrant Population in Different Urban Areas of Asansol Region during 1973-1990

Fig 4.4
Source: Socio-Economic and Demographic Profile of People in the ADPA: 2000-2001, ADDA
It is obvious from the above chart that there had been a huge influx of migrants in this region. Thus, the adverse production scenario of coal and steel industries during the 80’s did not tell upon the attraction of this region. The employment scenario was positive in most of the towns except Durgapur. Durgapur was mainly a public sector industrial town. Thus the scope of new job was mainly limited in the organised sector. As employment was the main pull factor in this region, more people in migrated in those towns where there were scopes of various types of jobs.
The gender ratio of the region as shown in the table 4.17 supports our views regarding the settlement pattern.
Table 4.17
Changes in the Gender Ratio, 1971-1991
Urban area/Town
|
Gender Ratio
| ||
1971
|
1981
|
1991
| |
Asansol
|
751
|
802
|
832
|
Kulti
|
784
|
827
|
845
|
Raniganj
|
780
|
815
|
844
|
Chittaranjan
|
774
|
797
|
807
|
Durgapur
|
764
|
837
|
825
|
H. Cables Town
|
772
|
895
|
847
|
Jamuria
|
792
|
851
|
875
|
Source: Computed from the data of Census of India, District Census Handbook, Barddhaman 1971, 1981 and 1991
The trade pattern of the region during this time period also reflected the demand for groceries and stationeries besides the intermediate goods required for production. They are the signifiers of growing inhabitation. The exportable naturally specified the nature of heat intensive industrial goods. Table 4.18 shows the trade pattern of the selected towns in this time period.
Table 4.18
Trade Pattern, 1971-1991
Urban Area
|
Most Imp Commodity Exported
|
Most Imp Commodity Imported
|
No of Banks
|
Asansol(M)
|
Glass
|
Rice
|
20
|
Burnpur
|
Saleable Steel
|
Smelter
|
4
|
Kulti
|
Spun Pipe
|
Groceries
|
1
|
Raniganj
|
Coal
|
Petroleum
|
8
|
Chittaranjan
|
Steam Locomotives
|
Loco Components
|
1
|
Durgapur
|
Steel Products
|
Iron Ore
|
14
|
H.C. Town
|
Underground Telephone Cables
|
Cooper
|
1
|
Jamuria
|
Coal Products
|
Rice
|
1
|
Source: Census of India, District Census Handbook, Barddhaman 1971, 1981 and 1991
The following Table 4.19 shows the number of nationalised commercial banks in the selected towns and cities in this region. These nationalised banks were also partners of the public sector industrialisation drive.
Table 4.19
Number of Banks, 1971-1991
Urban Area
|
No of Banks
|
Asansol(M)
|
20
|
Durgapur
|
14
|
Raniganj
|
8
|
Kulti
|
1
|
Jamuria
|
1
|
Chittaranjan
|
1
|
H.C. Town
|
1
|
Source: Census of India, District Census Handbook, Barddhaman 1971, 1981 and 1991
These banks were not evenly distributed in the region. The above table shows that the maximum number of banks was in the two cities Asansol and Durgapur. No wonder that the banks rush to that area only which is more urbanised, where they can get more deposits and where they can create more credit.
The work participation rate for main workers is a significant indicator of economic growth for this region. Table 4.20 shows the percentage of main workers to total population, 1981 and 1991.
Table 4.20
Percentage of Main Workers to Total Population, 1981-1991
Urban area/Town
|
Percentage of Main Workers to total population
| |||||
1981
|
1991
| |||||
Person
|
Male
|
Female
|
Person
|
Male
|
Female
| |
Asansol
|
23.51
|
38.03
|
5.42
|
26.38
|
45.34
|
3.58
|
Raniganj
|
27.39
|
47.37
|
2.82
|
28.48
|
49.51
|
3.47
|
Kulti
|
21.84
|
39.04
|
1.04
|
22.15
|
39.10
|
2.10
|
Jamuria
|
21.06
|
36.47
|
3.10
|
23.06
|
21.84
|
1.22
|
Durgapur
|
26.64
|
46.41
|
3.04
|
27.27
|
46.62
|
3.83
|
Chittaranjan
|
27.23
|
46.34
|
3.25
|
27.57
|
46.37
|
4.29
|
H.C. Town
|
24.62
|
44.10
|
3.36
|
27.45
|
46.86
|
5.05
|
Source: Computed from the data of Census of India, District Census Handbook, Barddhaman 1981 and 1991
The work participation rate for the main workers has increased for all the nodal centres. It illustrates the public sector policy regarding employment as discussed earlier. However, it also reveals the vulnerable employment scenario for the female population. While approximately 30% males were main workers and less than 5% of female population were main workers in the eighties.
4.4 Asansol Region in the First Decade of the Post-Liberalised Era, 1991-2001
In the late 80’s the Central government eased restriction on capacity expansion for incumbents, removed price controls and reduced corporate taxes. It led to a high fiscal deficit and a worsening current scenario. Moreover the collapse of the Soviet Union, India’s major trading partner and the first Gulf War caused a rise in oil price. It led to a major balance of payment crisis for India. In 1991, the Indian government initiated the economic liberalisation policy to revamp the economy .The reforms did away with the stringent license rules , ended many public monopolies, closed many public sector units and allowed automotive approval of foreign direct investment in many sectors. It is curious to note how Asansol fared during the wake of this changing context.
The economic base theory (Harvey, 2000) assumes that there is relation between population growth and the prosperity of the city. There has been a shift in the pattern of urban growth in this region. Table 4.21 below depicts it.
Table 4.21
Decadal Growth Rates of Population, Size Class/ Status, Spatial Area (in Sq Km) in the Selected Towns, Asansol Region, 1991-2001
Urban area/Town
|
Growth Rates of Population 1991-2001
|
Size Class/Status in 2001
|
Area in sq Km
|
Growth Rates of Population 1991-2001(adjusted)
| |
1991
|
2001
| ||||
Jamuria
|
468.20
|
1/M
|
6.22
|
73.23
|
9.40
|
Kulti
|
167.15
|
1/M
|
7.90
|
99.57
|
15.89
|
Raniganj
|
87.40
|
1/M
|
4.79
|
23.44
|
34.87
|
Asansol
|
81.34
|
1/M.C
|
25.02
|
127.87
|
0.36
|
H.C. Town
|
19.73
|
111/CT
|
3.90
|
3.90
|
-
|
Durgapur
|
15.87
|
1/M.C
|
154.20
|
154.20
|
-
|
Chittaranjan
|
-2.60
|
111/CT
|
19.65
|
19.65
|
-
|
Sources: Compiled from i)Census of India, District Census Handbook, Barddhaman 2001, ii)Census of India 2001, Series 20, West Bengal, Provisional Population Totals, Paper 2 of 2001, p T-97, Table 5.
The above table shows that there was sharp growth rate of population in Jamuria, Kulti, Raniganj and Asansol. This population growth was unnecessarily magnified as all these towns experienced expansion of spatial jurisdiction. The urban status of Jamuria, Kulti and Asansol also changed. For example, the area of Asansol city expanded as the city turned from Municipality to Municipal Corporation with the added spaces as noted earlier. Kulti was merged with Barakar. Many small towns which acquired the status of new towns during the earlier two decades were merged to some of these towns. Sripur and Sarakdi Nadiha for instance were merged to Asansol city. Similarly some mining towns of 1991 like Pariharpur, Ninga and Kaithi were merged to Jamuria. Kulti and Jamuria turned from Non Municipal Town to Municipalities leading to a population rise. Moreover among these towns, Jamuria occupied upper position than Raniganj in the urban hierarchical structure. Jamuria incorporated a large number of mining based manufacturing towns. In fact, the above table shows that the rate of adjusted population growth rate of these towns were considerably lower. It was only 0.36% in Asansol city.
As the above table depicts, Durgapur turned from Notified Area to Municipal Corporation. The spatial jurisdiction of the post independent public sector manufacturing towns Durgapur, Hindusthan Cables Town and Chittaranjan remain unchanged 1991-2001. They experienced either stagnant or negative rate of population growth. Among them, Chittaranjan which suffered the negative rate of population growth was a single industry town.
The following Table 4.22 also supports the tendency of slow growth in this region.
Table 4.22
Percentage of In-Migrant Population over the Time Period 1991-99
Year of Migration
|
Percentage of migrants residing in
| ||||
Durgapur
|
Asansol
|
Raniganj
|
Kulti
|
Jamuria
| |
1991-99
|
17.00
|
12.90
|
12.70
|
12.20
|
11.90
|
Source: Asansol Durgapur Development Authority (2001). Socio-Economic and Demographic Profile of People in the Asansol-Durgapur Planning Area 2000-01, Asansol.
The migration rate reduced in the recent decades from the earlier periods and according to socio economic report of ADPA, 1999-2000, the main cause is the gradual slowing of industrial activities and mining.
The urban centres had already the required built infrastructure for settlement created in the earlier prosperous periods as we noted. The in migrants of the earlier periods were settled with families and turned to second generation residents now. Thus the gender ratio became more balanced as shown by the Table 4.23.
Table 4.23
Changes in the gender ratio, 1991-2001
Urban area/Town
|
Gender ratio
| |
1991
|
2001
| |
Asansol
|
832
|
895
|
Raniganj
|
844
|
887
|
Kulti
|
845
|
897
|
Jamuria
|
875
|
887
|
Durgapur
|
825
|
871
|
Chittaranjan
|
807
|
872
|
Hindusthan Cable Town
|
847
|
914
|
Source: Computed from the data of Census of India, District Census Handbook, Barddhaman 2001
However, the overall sluggish industrial scenario is revealed as the percentage of main workers in the 90’s reduced by a significant volume than that in the 80’s. Table 4.24 illustrates it.
Table 4.24
Percentage of Main Workers to Total Population in the Asansol Region 2001
Urban area/Town
|
Percentage of main workers to total population (2001)
| ||
Person
|
Male
|
Female
| |
Asansol
|
23.90
|
40.73
|
5.10
|
Raniganj
|
26.41
|
45.05
|
5.10
|
Kulti
|
21.20
|
37.19
|
3.37
|
Jamuria
|
21.81
|
37.37
|
4.22
|
Durgapur
|
26.40
|
43.12
|
7.21
|
Chittaranjan
|
27.45
|
46.62
|
5.45
|
Hindusthan Cables Town
|
26.45
|
43.36
|
7.73
|
Source: Computed from the data of Census of India, District Census Handbook, Barddhaman 2001
On the other hand, there have been significant rises in the percentage of marginal workers both male and female in the last decade as shown in the Table 4.25.
Table 4.25
Percentage of Marginal Workers to Total Population in the Asansol Region 1991 and 2001
Urban area/Town
|
Percentage of marginal workers to total population
| ||||||
1991
|
2001
| ||||||
Person
|
Male
|
Female
|
Person
|
Male
|
Female
| ||
Asansol
|
0.19
|
0.22
|
0.14
|
4.33
|
6.15
|
2.31
| |
Raniganj
|
0.95
|
0.49
|
1.49
|
3.34
|
4.55
|
1.95
| |
Kulti
|
0.45
|
0.59
|
0.28
|
5.76
|
8.31
|
2.93
| |
Jamuria
|
0.04
|
0.03
|
0.01
|
0.51
|
0.75
|
0.24
| |
Durgapur
|
0.25
|
0.26
|
0.24
|
4.75
|
6.19
|
3.09
| |
Chittaranjan
|
0.04
|
0.06
|
0.01
|
0.51
|
0.75
|
0.24
| |
H.C.Town
|
1.46
|
0.60
|
0.01
|
3.13
|
3.42
|
2.82
| |
Source: Computed from the data of Census of India, District Census Handbook, Barddhaman 2001
There appeared a trend towards the proliferation of the small scale units by the end of the 90’s (Raychaudhuri and Basu, 2007). Most of these small industries suffered in the earlier decades due to strict control over their raw materials. The nature of the activities was such that they hired workers for less than 183 days in a year. For example there were small scale units in Asansol, Durgapur and Raniganj areas whose main activities were fabrication works, manufacturing gate and grills, repairing of motor generating set, steel furniture, electrical equipment, automobile repairing ,mining equipment, coal tub, steel casting, cement, dehydrate coal tar wooden furniture, stone crushing, embroidery items etc. Furthermore, the female inhabitants were participating more in the production process. The preceding table shows that a higher participation ratio for female population. They were either motivated or forced in this recession period to be better equipped for income earning. For instance, to cater the high end market the number of small enterprises producing exquisite garments and home decor were significant in Asansol–Durgapur region. These enterprises employed a considerable number of female workers (Sub DIC, Government of India). The growing demand for these products and the advantage of good transport system here were the positive forces behind the growth.
4.4.1 The State of the Region in Apparent Recession, 1991-2001
This region was experiencing the impact of the new economic policy of the government. According to the records available with the Chief Inspector of Factories, till 1995, 26.8% of 313 registered units were closed. Almost 48% of the closed units were in Durgapur followed by Asansol 16% and Raniganj 15% (Guha, 1996). The Table 4.26 reveals the list of some of the sick and closed industries in this period.
Table 4.26
Sick/Closed Industries in the Asansol Region 1991-2001
Name
|
Type of industry
|
IISCO, Burnpur
Kulti Iron Works
Cycle Corporation of India ( Sen Raleigh)
J.K Nagar Aluminium Corporation Ltd
Hindusthan Cables
Burn Standard Co. Ltd
Chittaranjan Locomotive Works
MAMC, Durgapur
Bengal Paper Mill, Raniganj
|
Basic Metal
Basic Metal
Engineering Industry
Engineering Industry
Engineering Industry
Engineering Industry
Engineering Industry
Engineering Industry
Paper and Pulp Industry
|
Pilkinton Glass ,Asansol
Hindusthan Fertilizer, Durgapur
Indian Oxygen Co, Asansol
|
Chemical Industry
Chemical Industry
Chemical Industry
|
Source: Compiled by the author
ECL was running at a loss for decades and faced the consequences of referral to the Board for Industrial and Financial Restructure on 1997. About 64 mines in 97-98 were closed and 72,000 workers lost their job. There were 1.8 lakhs workers at ECL in 1973-74 which increased to 1.92 lakhs in 1983-84. In 1993-94, it reduced to 1.74 lakhs.
Table 4.27 shows the decrease in the production (in MT) of underground mines of ECL and most of the mines in this region were Underground mines.
Table 4.27
Production (in MT) of Underground Mines
ECL
|
74-75
|
84-85
|
94-95
|
2001-02
|
UG
|
20.50
|
16.67
|
13.61
|
11.66
|
4.4.2 A Review of the Apparent Deceleration
Continuing our above discussion, what seems the closure of sick mining and other industrial units could be in fact the beginning of a fresh era of economic activity known as liberalisation. An industry or the industries which closed down or became sick in the 90’s belonged to the economic ethos forged in the 50’s. Thus they failed to survive in the competitive market of the 90’s.
To be at par with the global production, the economy needed more skilled labour during the beginning of this post liberalised era. The employment policy of the Government also changed. The Government did not hire these skilled workers all the times but gave sub contract to the private sector whose employment policy was not transparent.
Moreover the private investment in the colliery sector was also a significant development in the liberalised era. In 1992, the central government decided to incorporate private organisations in the production of electricity. In order to get the private sector interested in the project, the Nationalisation act of 1973 was amended. The amendment enabled the government to grant captive mines to the coal-washeries of the private sector. In continuation with these developments, public private partnership in the extraction of coal started here in 1995 (Mukherjee and Banerjee, 2003).
The mushrooming of the sponge iron factories in the Asansol region by private entrepreneurs are also the proof of privatisation of the units of the regional economy. Whether they are polluting the environment is however a separate issue.
To explore the current socio- economic scenario here, in the next section comparative study is done between the information available from a primary survey in this region in 2007 with an earlier field based study carried out here during 1994- 1995 (Lahiri-Dutt, 2001) and then with the data available from the latest Census record 2001.
4.5 Summary of the Primary Survey among the Employees of ECL in the Three Coal Mines Emphasizing on Their Present Socio-Economic Status
A primary survey was carried out by us in 2007 in the three coal mines of this region (Kajora, Kenda and Salanpur) to find out the present socio- economic scenario with reference to an earlier study done in the region in 1994-‘95 by Lahiri-Dutt (2001).
Kajora is in the C.D. Block Ondal. A total of hundred employees from different departments of ECL were interviewed there. Kenda area lies just to the northwest of Kajora area. It is situated in the C.D. Block Jamuria. Ninety-one employees were interviewed here. Salanpur as the name implies is located in the C.D Block Salanpur in the north- western corner of the Raniganj coal belt. A total of hundred employees were interviewed here.
The following table 4.28 shows that the percentage of male employees increased in all the three collieries from 1994-95 to 2007. In-migration reduced in the two collieries during this period.
Table 4.28
Background Characteristics of the Respondents in the Three Collieries (%)
1994-95 and 2007
Characteristics
|
Kajora
|
Kenda
|
Salanpur
| |||
1994-95
|
2007
|
1994-95
|
2007
|
1994-95
|
2007
| |
Male
|
87.10
|
97.00
|
93.75
|
96.70
|
84.05
|
93.00
|
Migrated
|
36.40
|
25.00
|
46.88
|
65.56
|
43.61
|
24.00
|
Sources: i) The Centre for Urban Economic studies University of Calcutta and Australian National University (2007). Migration, Urbanisation and Women’s Status in the Raniganj Coalbelt, The report of A Joint Project. ii) Lahiri-Dutt, Kuntala (December, 2001). Mining and Urbanization in the Raniganj Coalbelt, Calcutta, The World Press Private Limited.
The following Table 4.29 gives a comparison of the income structure of the employees in the three collieries during 1994-95 and 2007.
Table 4.29
Income Structure of The Respondents of three collieries (%) in 1994-95 and 2007
Income / month
|
Kajora
|
Kenda
|
Salanpur
| |||||||||
1994-95
|
2007
|
1994-95
|
2007
|
1994-95
|
2007
| |||||||
0 – 2000
|
8.58
|
87.36
|
14.00
|
30.21
|
100.00
|
24.18
|
17.02
|
94.67
|
32.00
| |||
2000 – 4000
|
40.40
|
66.66
|
52.12
| |||||||||
4000 – 8000
|
38.38
|
3.13
|
25.53
| |||||||||
8000 - 10000
|
12.64
|
30.00
|
86.00
|
0.00
|
45.05
|
75.82
|
5.33
|
48.00
|
68.00
| |||
10000-12000
|
44.00
|
27.47
|
14.00
| |||||||||
12000 - 16000
|
11.00
|
2.20
|
6.00
| |||||||||
>
16000
|
1.00
|
1.10
|
0.00
| |||||||||
Sources: Compiled from i) The Centre for Urban Economic studies University of Calcutta and Australian National University (2007). Migration, Urbanisation and Women’s Status in the Raniganj Coalbelt, The report of A Joint Project.
ii) Lahiri-Dutt, Kuntala (December, 2001). Mining and Urbanization in the Raniganj Coalbelt, Calcutta , The World press Private Limited.
The comparative study establishes the fact that though ECL was running at a loss for decades and some of the sick mines were closed, still there was a considerable hike in the salary due to the Fifth Pay Commission recommendation. ECL being a government undertaking was thus bound to enhance the salary of its employees. As a consequence, in 1994-95 only 12.64 % respondents of Kajora, 5.33% respondents of Salanpur and none in Kenda earned income above Rs 8,000 per month, while in 2007 the same increased to 86% employees of ECL in Kajora, 75.82% in Kenda and 68% in Salanpur. Thus the adverse production scenario in this nationalised mining industry did not adversely affect the employees here as the salary structure of ECL employees was not dependent entirely on its productivity. Indian economy being a mixed economy, some of the market forces which generally operate in a market economy remained inoperative. Due to this salary structure, they enjoyed a better standard of living as the following comparative studies depict.
The housing characteristics as available from the survey among employees of ECL in the chosen collieries have been compared with the housing characteristics of the population of their respective C.D. Blocks in tables 4.30, 4.31 and 4.32.
Table 4.30
Comparison of Housing Characteristics - Employees of ECL in Kajora colliery and the Population in the C.D Block Ondal
Housing Characteristics
|
C.D. Block Ondal
|
Kajora Colliery
|
Sources of Water-Pipe water
|
29.51
|
18.00
|
Sources of Water-Well water
|
60.77
|
39.00
|
Electricity
|
72.96
|
84.00
|
Sanitation Facility- sanitary
|
43.43
|
95.00
|
Fuel- LPG
|
13.14
|
23.00
|
Fuel- coal
|
81.21
|
36.00
|
Residence- Own house
|
50.23
|
56.00
|
Sources: i) Compiled from Census of India 2001, Series 20, West Bengal (ii) CUES, University of Calcutta and Australian National University (2007). Migration, Urbanisation and Women’s Status in the Raniganj Coalbelt, The report of A Joint Project.
There are disparities in the urban amenities available in the C.D. block Ondal and in the colliery area Kajora as shown by the above table.
The following table 4.31 shows gross disparities in most of the housing characteristics of the C. D. block Jamuria and the colliery area Kenda.
Table 4.31
Comparison of Housing Characteristics - Employees of ECL in Kenda and the Population of the C.D. Block Jamuria
Housing Characteristics
|
C.D. Block Jamuria
|
Kenda colliery
|
Sources of Water-Pipe water
|
46.40
|
14.29
|
Sources of Water-Well water
|
51.41
|
3.30
|
Electricity
|
94.95
|
81.32
|
Sanitation Facility- sanitary
|
37.91
|
96.70
|
Fuel- LPG
|
1.90
|
8.79
|
Fuel- coal
|
92.98
|
39.56
|
Residence- Own house
|
41.13
|
13.19
|
Sources: Compiled from i) Census of India 2001, Series 20, West Bengal
ii) The Centre for Urban Economic studies University of Calcutta and Australian National University (2007). Migration, Urbanisation and Women’s Status in the Raniganj Coalbelt, The report of A Joint Project.
The C.D. block Jamuria seems to have more urban attributes than the colliery area Kenda. However, the huge disparity in the sanitary facility, an important component of urban housing characteristic makes it difficult for a concrete inference.
Table 4.32
Comparison of Housing Characteristics - Employees of ECL in Salanpur and the Population of the C.D. Block Salanpur
Housing Characteristics
|
C.D. Block Salanpur
|
Salanpur colliery
|
Sources of Water-Pipe water
|
80.15
|
71.43
|
Sources of Water-Well water
|
18.24
|
0.00
|
Electricity
|
89.67
|
93.00
|
Sanitation Facility- sanitary
|
79.09
|
90.00
|
Fuel- LPG
|
55.22
|
15.00
|
Fuel- coal
|
35.00
|
36.00
|
Residence- Own house
|
20.58
|
20.00
|
Sources: Same as Table 4.31 above
Apart from the use of fuel- LPG, the C.D. Block Salanpur and the colliery area of Salanpur have exhibited similar housing conditions.
4.6 Conclusion
This chapter is a study of Asansol region in the post independence era, 1951-2001. It explains the nature of the welfare maximising public sector industrialisation programmes which played a very important role in producing new industrial-urban space and altering the urban hierarchical structure in this region. We have analysed the spatio- temporal changes here by dividing the whole period into three sub periods based mainly on the industrial strategy of the Indian government. As any city is part of a region and cannot be studied in isolation, we have described here the course of evolution of the major urban centres of the region by analysing some common demographic variables and socio- economic indicators for these centres. They show widespread intra town variations in population density and other socio- economic characteristics.
Subsequently, it focuses on the impact of nationalisation of coal and other industries here. It shows how the construction activities of ECL helped in the growth of new mining based manufacturing towns in the 80’s and 90’s. Rise in the rate of employment and urban amenities resulted in the formation of the new towns. Then we have analysed the reasons for adverse production scenario beginning from the end seventies.
Afterwards it studies the spatio- economic changes during the first decade of the post liberalised era. It shows that many mining based towns were merged with the large towns. The study shows that besides Asansol some of the important towns here like Kulti and Jamuria have expanded in size and thus rapidly urbanised. They have incorporated some adjacent urban and rural areas.
Then this chapter analyses how the shift of the government economic policy from welfare maximisation to liberalisation and privatisation resulted in the closure of many sick industrial units during this period.
The study also analyses the facts gathered from a primary survey on employees of Eastern Coalfields Limited to have a glimpse of the current urbanisation scenario. The comparisons of these socio- economic indicators with an earlier field based study as well as with the similar census data of their respective C.D. blocks show that hike in living standard of ECL employees did not evenly benefit the whole local economy because of the reasons discussed in section 4.5 above.
However, the burning issue which is not directly under the purview of our study is the growing problem of land subsidence, illegal mining and underground fire in this region. We are discussing them in the appendix. It reveals how the region is gradually becoming vulnerable one due to growing incidence of land subsidence.
In the next chapter we will analyse the various spatio economic changes within the Asansol city during this long time span of last fifty years.
Appendix to Chapter 4
4.1 Land Subsidence and Illegal Mining- The Dangers Ahead
Land subsidence is the vertical or horizontal movements of surface, sub surface and underground block of land caused by indiscriminate coal mining and lack of improper stowing operation. Thus coal mining; both underground and opencast can cause extensive damage to the environment if adequate environmental protections and remedial measures are not taken (TERI Report No 2003 RD 62). Any region based on mining resources can experience different impacts of environment as follows:
- The pre mining phase: The report of TERI assumed that at the pre- mining stage, there could be impacts like displacement of people, cutting of forestland, removal of vegetation and a number of impacts due to acquisition of land.
- The operational phase: The environmental impacts of mining during the operational phase range from the impact on land, ground water quality and levels, air and water pollution and solid waste generation.
- The post mining phase: It has long- term implications for the ecology of the area. Negligence in planning of long term water management, safety and stability of mining voids and final rehabilitation can render the mining area inhabitable.
Another problem is the large-scale withdrawal of groundwater by illegal brick-kilns that has depleted the water level, disturbing the geological equilibrium and can trigger and cause subsidence.
Appendix Table 4.1 shows how the region under study is vulnerable to land subsidence.
Appendix Table 4.1
Status of Subsidence in Asansol- Raniganj Area
Name of the coal mining areas
|
Administrative Authority
|
Number of subsidence
|
Areas of subsidence (sq.m.)
|
Sodepur
|
ECL
|
7
|
299.26
|
Salanpur
|
3
|
15.78
| |
Sitarampur
|
10
|
1138.00
| |
Sripur
|
8
|
2585.90
| |
Satgram
|
14
|
3301.20
| |
Kunustoria
|
11
|
986.00
| |
Kajora
|
13
|
916.16
| |
Kenda
|
9
|
298.77
| |
Area XII
|
BCCL
|
7
|
694.88
|
Ramnagar
|
IISCO
|
2
|
21.29
|
Source: CMPDIL Asansol 1986 compiled from Dutta (2003). Impact of Environmental Problem on Land Use of Ajay Damodar Interfluve; Asansol Sub-Division, Unpublished Ph.D Thesis, Calcutta, Department of Geography, University of Calcutta.
According to a CMPDIL Report, out of 143 subsidences all over India, about 102 subsidences occurred in the Asansol sub division (CMPDIL Asansol, 1986).
However, the above figure is not exhaustive as a number of small subsidence in many parts of this region remain unreported over the years. In fact, there are numerous areas prone to subsidence or already damaged by subsidence. Major areas within Asansol Municipal Corporation, Jamuria, Raniganj and Kulti Municipality are very much prone to subsidence. The localities in Asansol like Borodighari, Chotodighari, Bartoria, Narsamuda, Fatepur, Barachak, Ramjibanpur, Marichkota, Baropukuria, Kalla, Satpukuria, Reckit Coleman area, Kalipahari, Ushagram, Mohisila, and Damra etc are some of them. During 1973 to 1999, nearly 10,000 acres of land was lost due to subsidence. Additionally, fire in abandoned coal pits has already grasped about 40 sq km area (Bandyopadhyay, 2005).
Illegal mining in this region aggravated the problem of subsidence. A lack of alternative employment opportunities and lackadaisical approach of the administration transformed illegal mining from a fringe activity to a well organised parallel economy in the last couple of years employing a large number of man power. Illegal mining becomes a reality of life in the coal bearing tract stretching from Raniganj in West Bengal westward to Dhanbad and other coal bearing areas of Jharkhand. Manual labourers’ community are most obliged to work in the ghost or abandoned collieries. Ghost colliery is common word in Asansol (Nayak, 2005). They have been closed and left abandoned earlier due to their uneconomic position. These mines are intimidating the entire infrastructural foundation of roads and rail ways as the illegal miners remove even the support pillars. The grave situation is threatening all the components of urban sustainability. These problems thus can affect the holistic development of this region.
No comments:
Post a Comment